Dark Matter Trapping by Stellar Bars:
The Shadow Bar

(click the title for link to ADS) We investigate the complex interactions between the stellar disc and the dark-matter halo during bar formation and evolution using N-body simulations with fine temporal resolution and optimally chosen spatial resolution. We find that the forming stellar bar traps dark matter in the vicinity of the stellar bar into bar-supporting orbits. We call this feature the shadow bar. The shadow bar modifies both the location and magnitude of the angular momentum transfer between the disc and dark matter halo and adds 10% to the mass of the stellar bar over 4 Gyr. The shadow bar is potentially observable by its density and velocity signature in spheroid stars and by direct dark matter detection experiments. Numerical tests demonstrate that the shadow bar can diminish the rate of angular momentum transport from the bar to the dark matter halo by more than a factor of three over the rate predicted by dynamical friction with an untrapped dark halo, and thus provides a possible physical explanation for the observed prevalence of fast bars in nature.

Experimental Set-up

The simulations are set up as an exponential stellar disk in an initially spherical NFW profile. We use two different halo models (a cusp model, F, and a core model, C) to increase the applicability of our findings for the uncertain dark matter structure of galaxies.


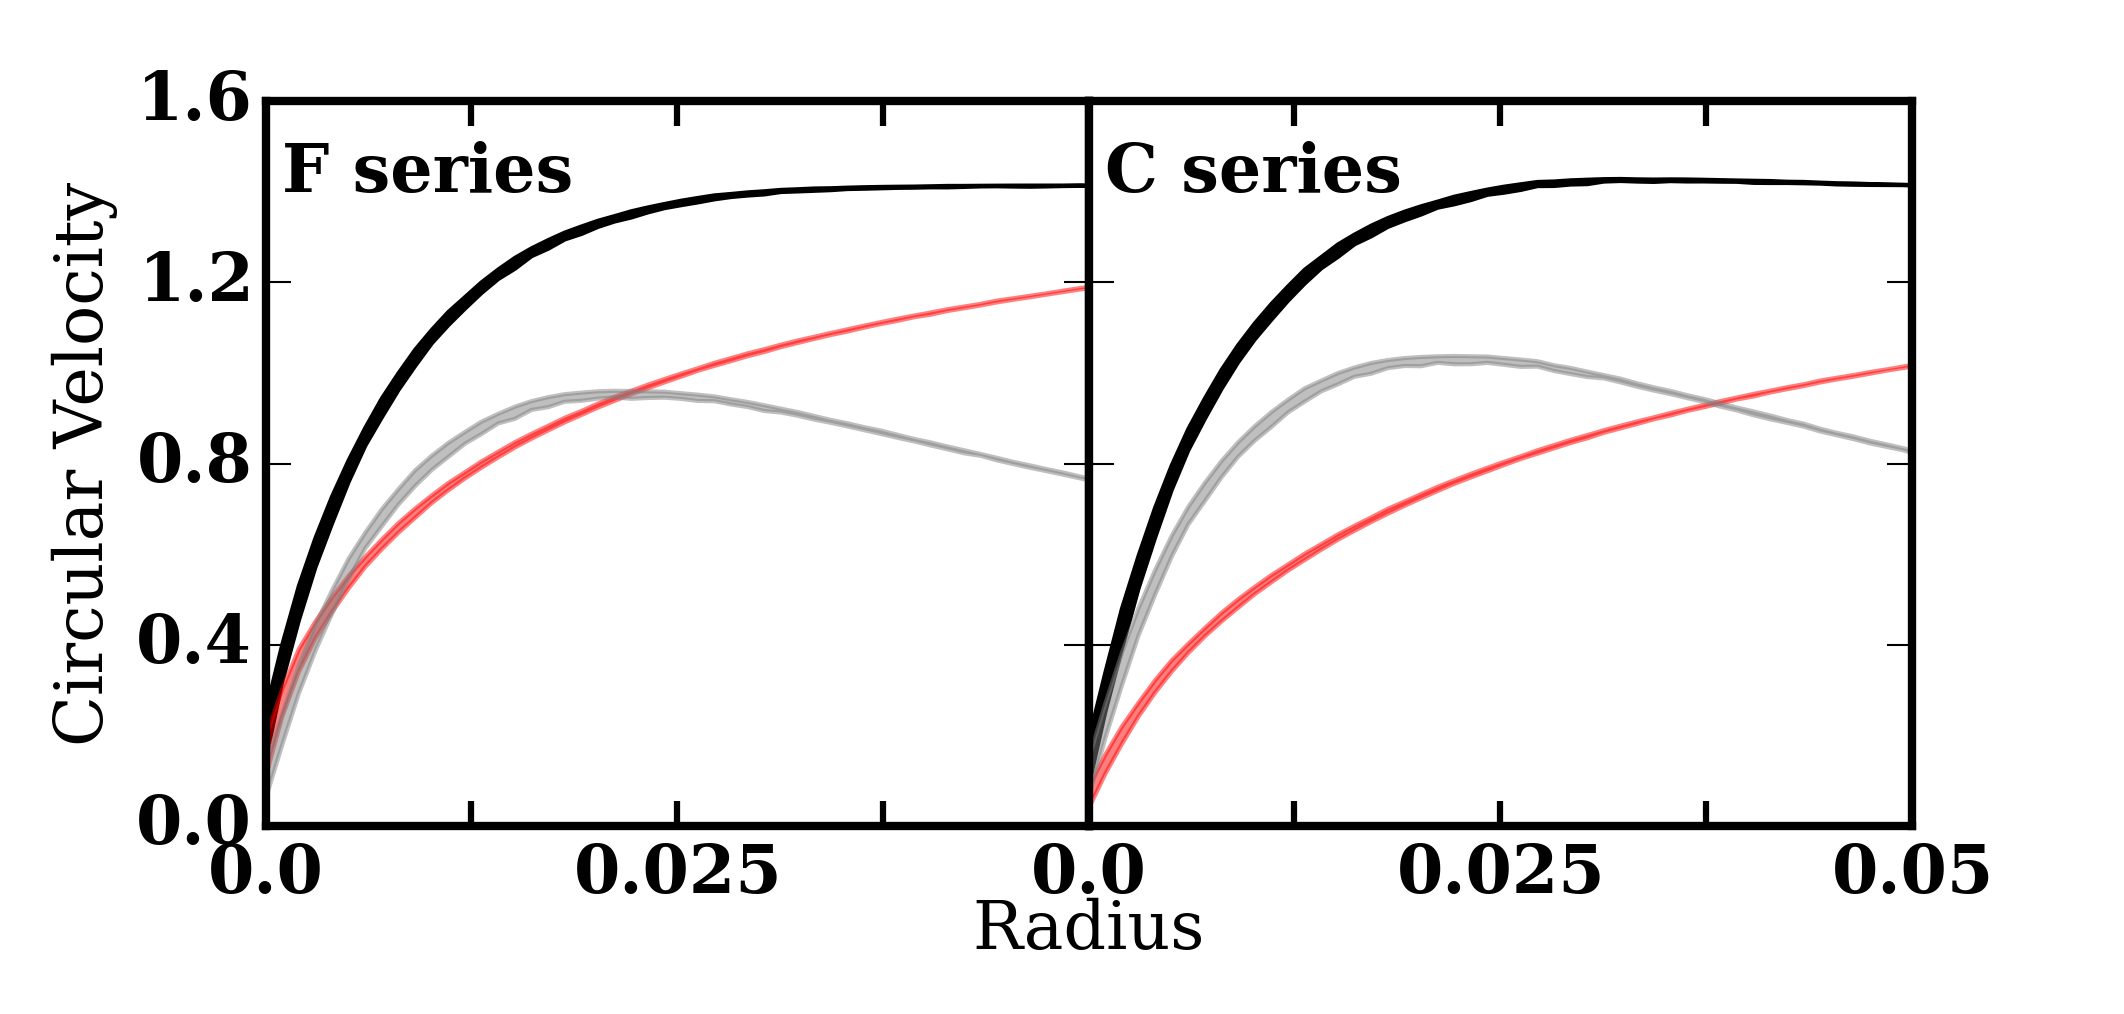
Initial circular velocity curves for the F-series cusp models (left panel) and C-series cored models (right panel). The circular velocity from p=0.2 to p=0.8 is shown in black where p is the quantile value for the rank-ordered circular velocities. The p=0.2 to p=0.8 contributions from the disc (gray line) and halo (red line) have been separated to demonstrate the maximality of the disc.


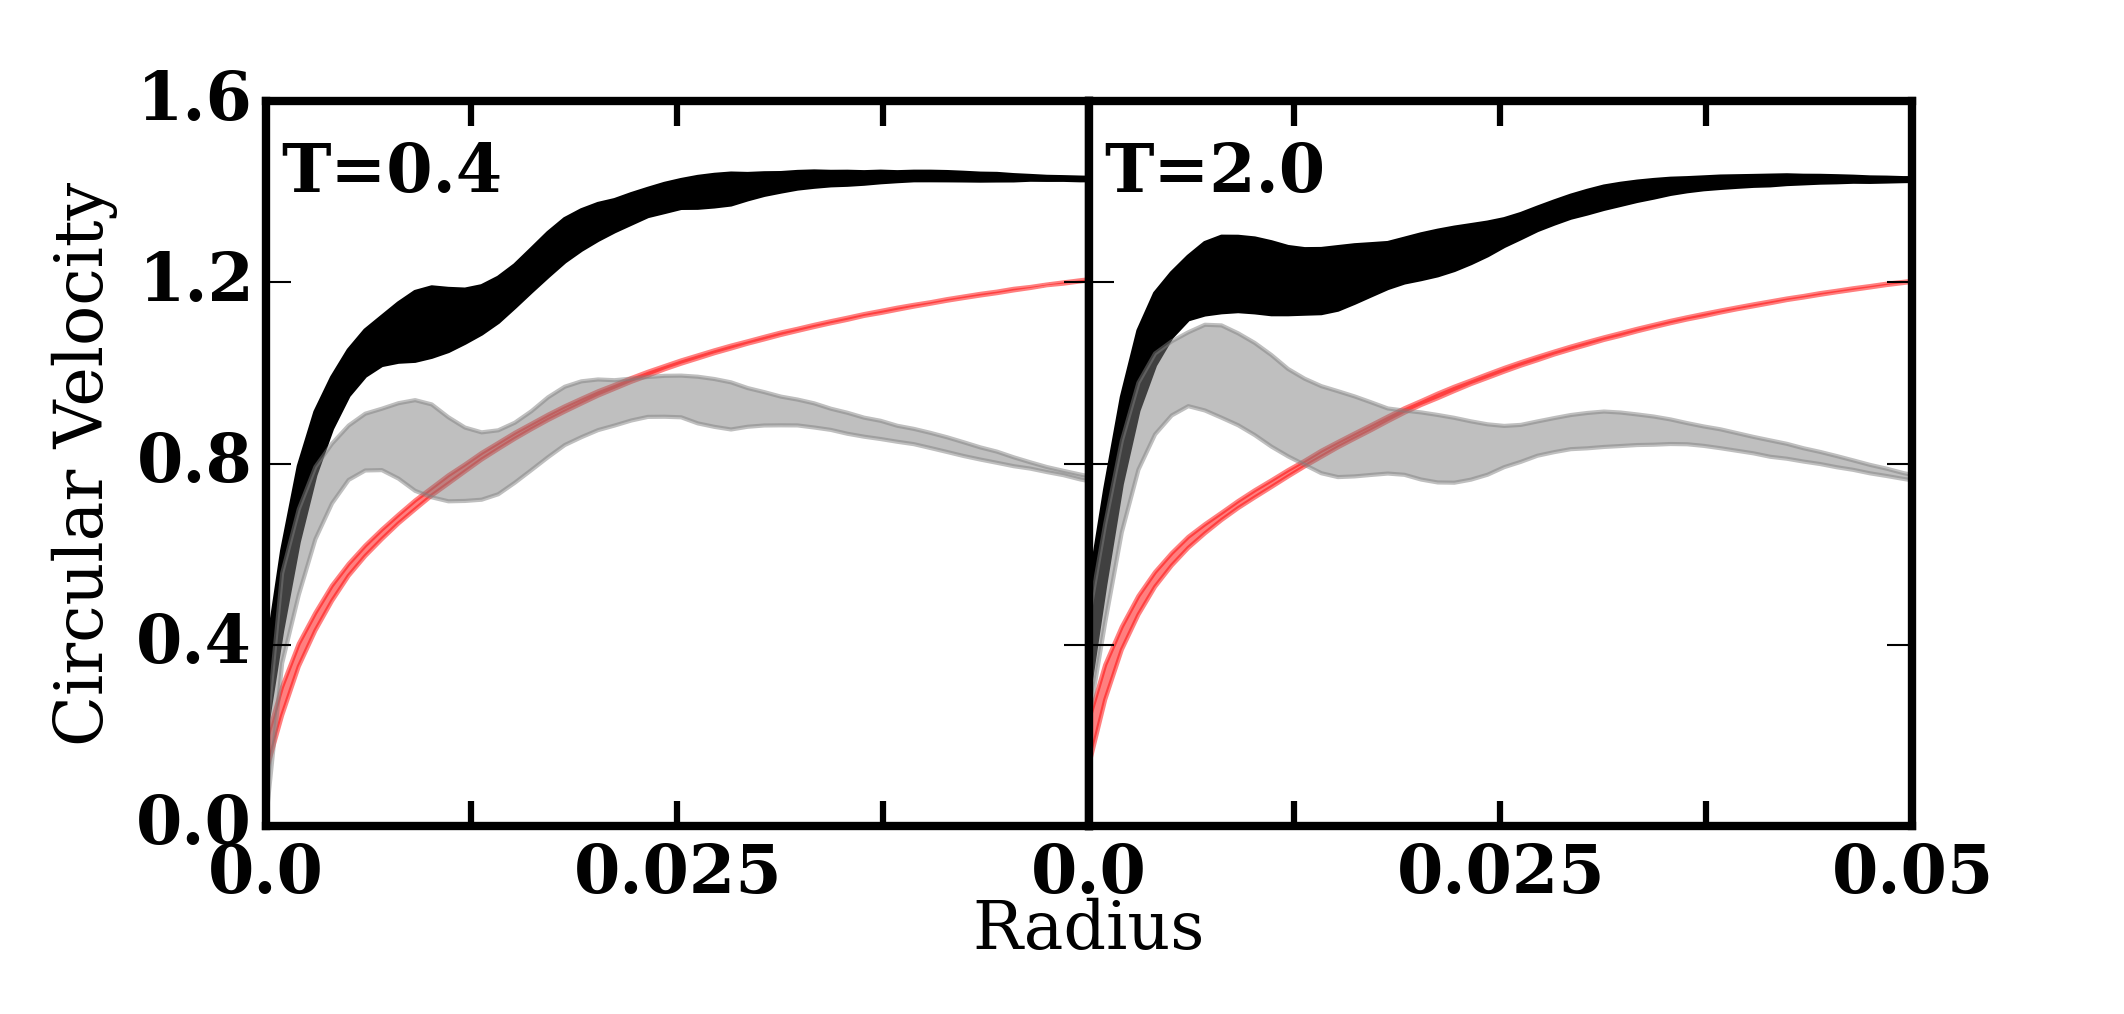
Circular velocity curves for the fiducial model at T=0.4 (left panel) and T=2.0 (right panel). The circular velocity from p=0.2 to p=0.8 is shown in black. The p=0.2 to p=0.8 contributions from the disc (gray line) and halo (red line), where p is the quantile value for the rank-ordered circular velocities, have been calculated separately to demonstrate the evolution of each component.


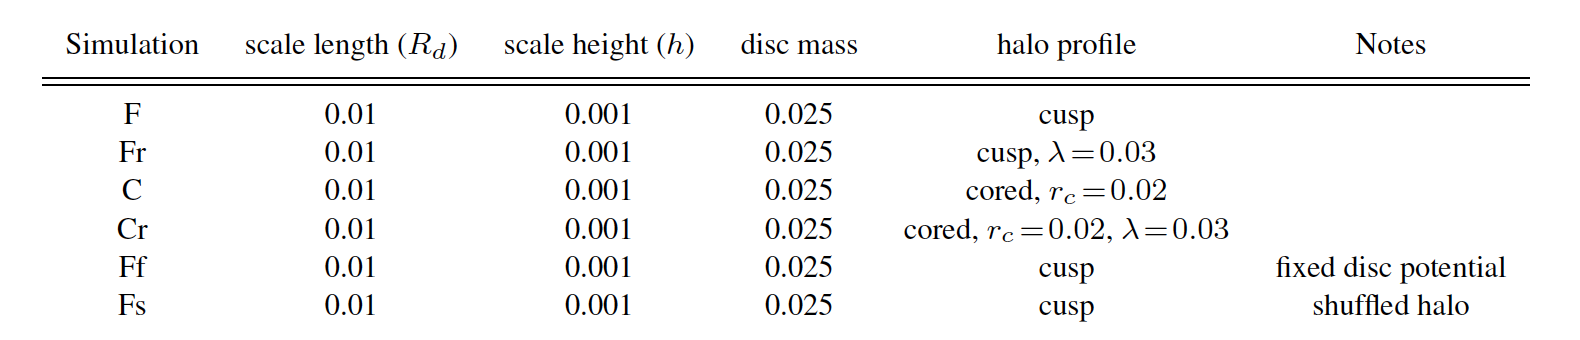
The list of simulations in the paper.

Results

New orbit-defining techniques allow for rapid and unambiguous determination of orbit morhpology. This allows us to measure the mass of the trapped component--including the mass of a trapped component in the dark matter halo.


The surface density of the fiducial simulation for the stellar disc (upper panels) and the dark matter halo (lower panels). The left panels show the in-plane density (|z|<0.003, ~1 kpc for MW-like scalings), the middle panels show the in-plane density of the trapped component (the stellar bar on the top and the shadow bar on the bottom), and the right panels show the in-plane density of the untrapped component, at T=2.0 (~4 Gyr for MW-like scalings).


Trapped populations by fraction of mass interior to R=0.01 (the initial scale length), as determined by k-means power, for the fiducial simulation. Left panel: disc trapping as a function of time. Middle panel: halo trapping as a function of time. The trapped halo fraction (the shadow bar) monotonically increases at all times. Right panel: The ratio of the shadow bar to stellar bar (by total mass) as a function of time. The halo is trapping at a faster rate than the disc, owing to the consistent increase in the reservoir of untrapped matter as the halo contracts in response to the bar growth.


From left to right: stellar disc trapping, dark matter trapping, and the ratio of dark-matter halo to stellar disc trapping by the bar inside R=0.01. Compare these to Fig. 4. From top to bottom the simulations are: the cusped rotating halo (Fr in Table 1), the cored nonrotating (C), and the cored rotating (Cr) models. Black lines indicate the total mass trapped scaled by the mass interior to R=0.01 and grey lines indicate the corresponding curve for the fiducial model.

Analysis

The dynamic analysis focuses on the change of the bar pattern speed, as well as the location of the resonant trapping. We define the "trapping angle" to be the average angle of the outer turning points relative to the bar, which can be used to identify orbit families.


Upper panel: the pattern speed for the fiducial simulation (black) and an azimuthally-shuffled halo to suppress shadow bar formation (Fs; the dashed blue line). The simulation time is limited to T<1.2 so that the stellar bars that form are still roughly equivalent. Lower panel: Change in pattern speed, following the same colour scheme. The shuffled simulation slows much more rapidly during the simulation, indicative of an increased Lz acceptance by the halo when there is no shadow bar.


Left panel: The distribution of trapping angle as a function of energy, E, vs. scaled angular momentum, Lz=Lmax(R), at T=2.0 for the stellar disc. At each radius, Lz and E are calculated for a circular planar orbit and used to determine the mapping between energy and radius, as well as the maximum Lz at a given radius. The quantity Lz=Lmax(R) is zero for a radial orbit and unity for a circular orbit. Nearly all disc orbits are prograde, Lz=Lmax(R)>0. The colours denote the average apse position relative to the position angle of the bar. The region in E-Lz space with insufficient density to obtain a reliable estimate is white. The disc is largely comprised of circular orbits at R>0.02. The dark blue region indicates the stellar bar.


Right panel: As in Fig. 7 for the dark matter halo. Retrograde orbits are now present and the Lz=Lmax(R) axis now runs from -1 to 1. The dark blue region in the upper left, with an x-hatched region overlaid, indicates orbits trapped into the shadow bar, which occupies the same region of E-Lz space as the stellar bar (compare to Fig. 7). Additional features from the k- means analysis are seen, including two retrograde populations at E=9.5 and E=8.2 that are transiently moving through the ILR and the CR, respectively. A prograde population is observed at OLR, E=6.5.

Conclusions

Our main findings are as follows:

(1) The stellar bar traps dark matter into a shadow bar. This shadow bar has a mass that is >6% of the stellar bar mass after the bar forms, and this ratio increases with time throughout the simulations to values >9% by mass. The halo is deformed by the presence of the disc as well as the continued torque from the stellar and shadow bar, creating a population of disc-like orbits (with a preferred angular momentum axis). We suggest that this reservoir increases the trapping rate of dark matter orbits.

(2) Trapping in the dark matter halo and the stellar disc takes place both at bar formation and throughout the simulation.

(3) The existence and strength of the shadow bar does not change appreciably in the presence of a core or rotation in the halo. However, the trapping rate of both the dark matter halo and the stellar component strongly depends on halo profile and the initial angular momentum distribution in the halo.

(4) The dark matter halo exhibits a density and velocity signature indicative of a reaction to the presence of the stellar disc at radii much larger than that of the bar radius. The density and velocity structure change with the angle to the bar, even at several bar radii. This could have important implications for direct dark matter detection experiments.

(5) Approximately 12% of the halo inside of the bar radius 16 is trapped after 4 Gyr. These trapped orbits are precisely the ones that dominate the secular angular momentum transfer to the halo in the absence of trapping. The trapping changes the secular angular momentum transfer rates that one would estimate without trapping. We demonstrate this point with a simulation that suppresses trapped orbits by artificially decorrelating the halo orbit apsides with the bar position. This increases the halo torque on the bar after formation by a factor of three! Stronger bars are likely proportionally larger fractions of their halos. This suggests that halo torques may be much smaller than theoretically predicted, especially for strong bars, helping to resolve the tension between the LCDM scenario and the observational evidence for rapidly rotation bars.